

This Liverpool vs Brighton preview starts with an odd split. Liverpool have the best away record in the Premier League. However, they have not won a league game at Anfield since April. Brighton arrive third, with the league’s most productive first halves and its tightest second halves.
Brighton enter Round 8 with 16 points from seven matches. They have a record of 5–1–1 and 23–5 in goals. Arsenal and Manchester City, who have played one more, are five points ahead. Liverpool are fifth on 12 (3 – 3 – 1, goals 9 – 8).
Bescored’s pre-match model leans towards the visitors, estimating a 44% chance of a Brighton win against 30% for Liverpool. History at Anfield points the other way.


The story at a glance
What frames the afternoon at Anfield
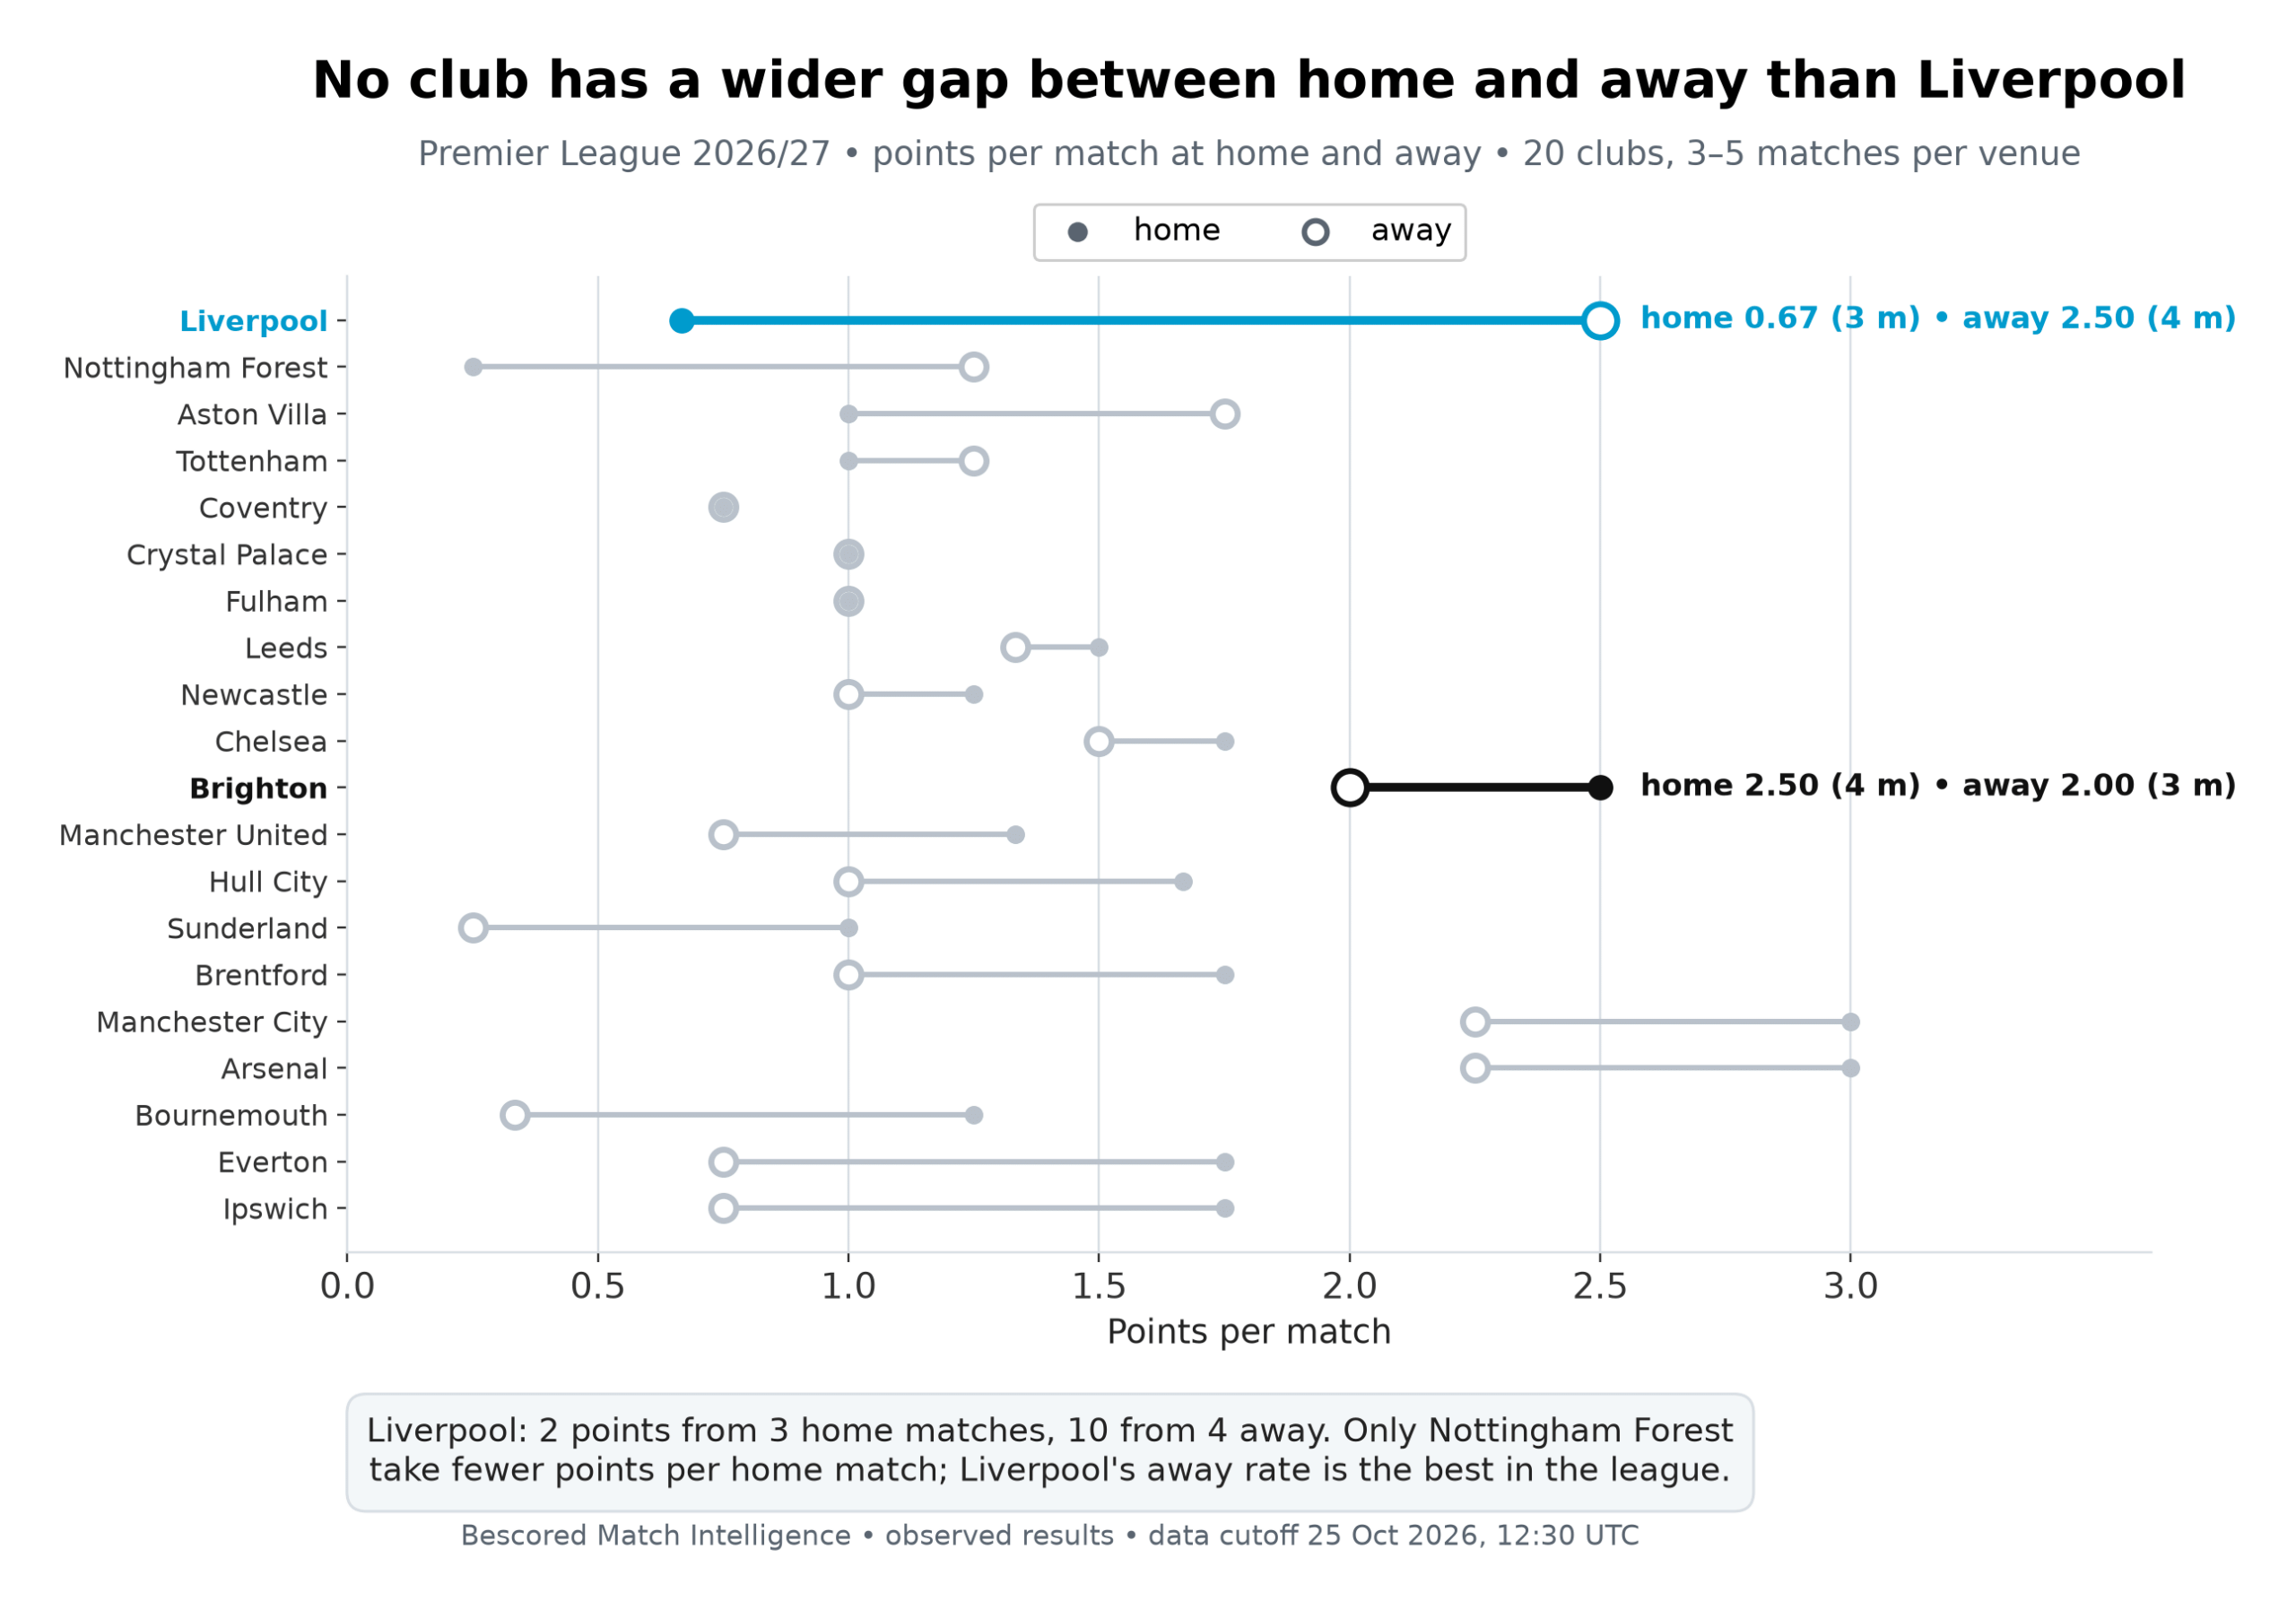
- Liverpool have 10 points from four away league matches, the best away rate in the division, but two from three at home. Their last five league games at Anfield brought no win.
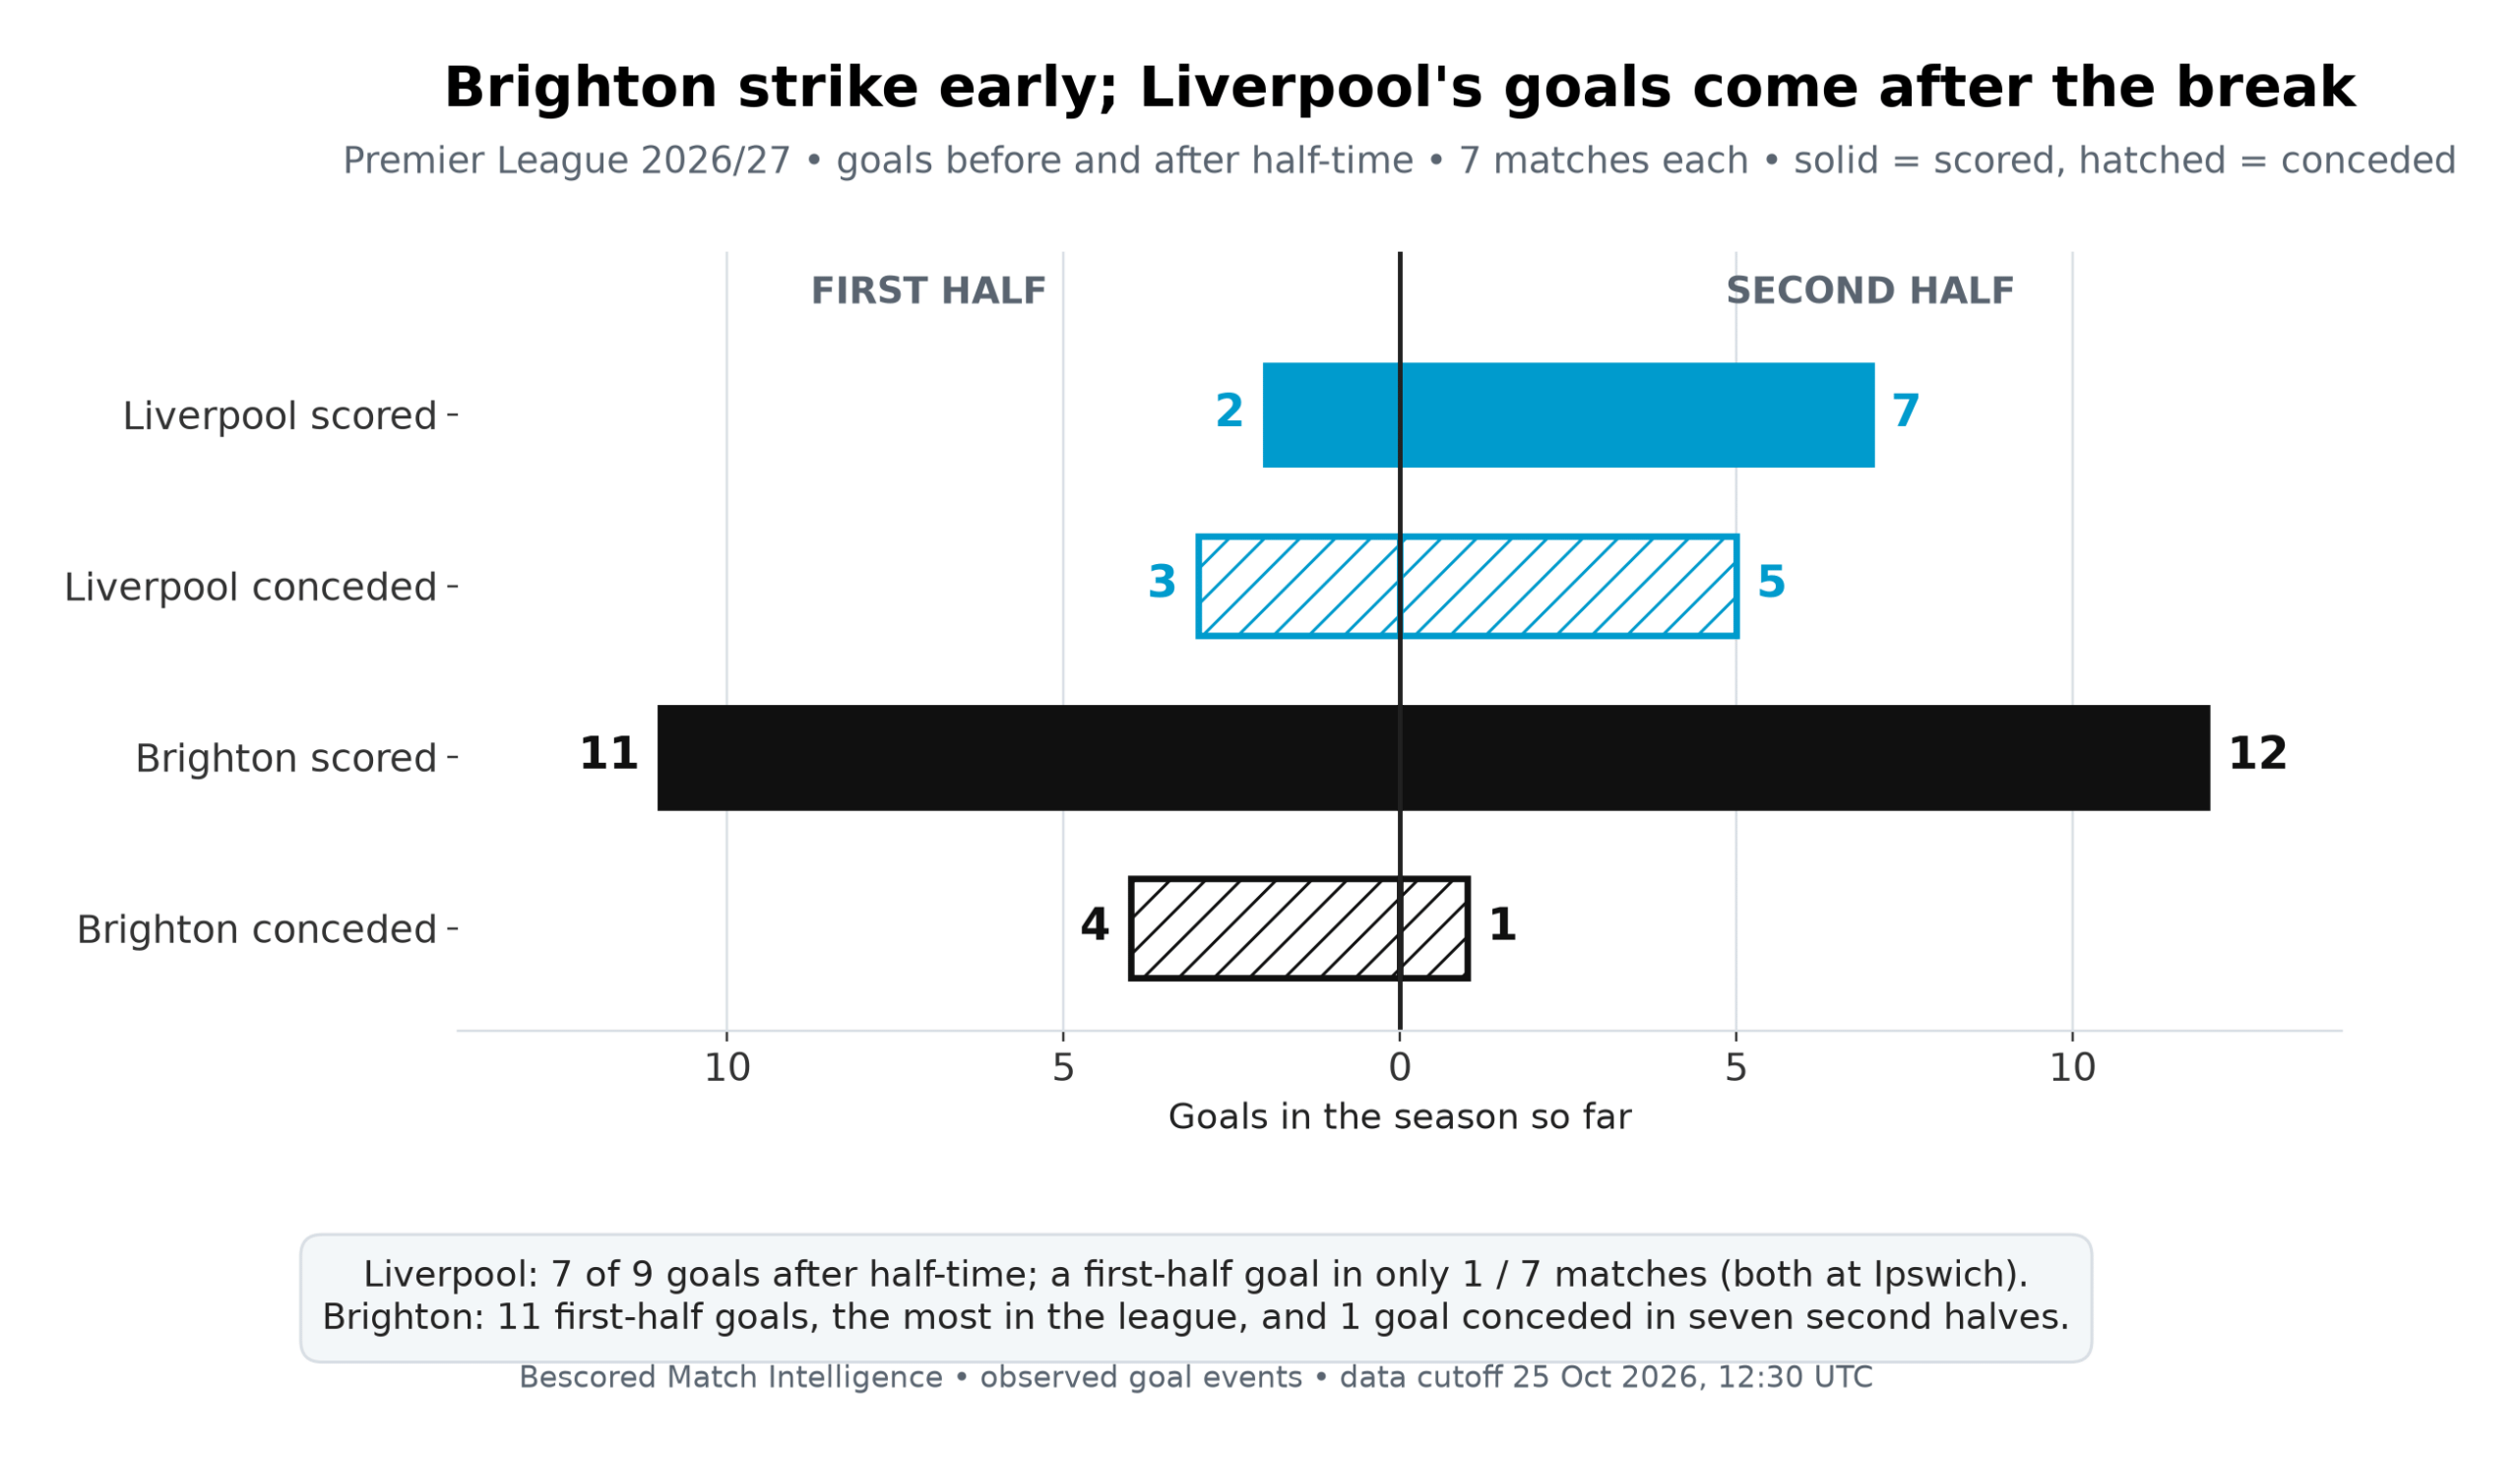
- Brighton have scored 11 first-half goals, the most in the league; Liverpool have scored before the break in 1 / 7 matches, and seven of their nine goals came after it.
- Brighton have conceded one second-half goal all season, the fewest in the Premier League.
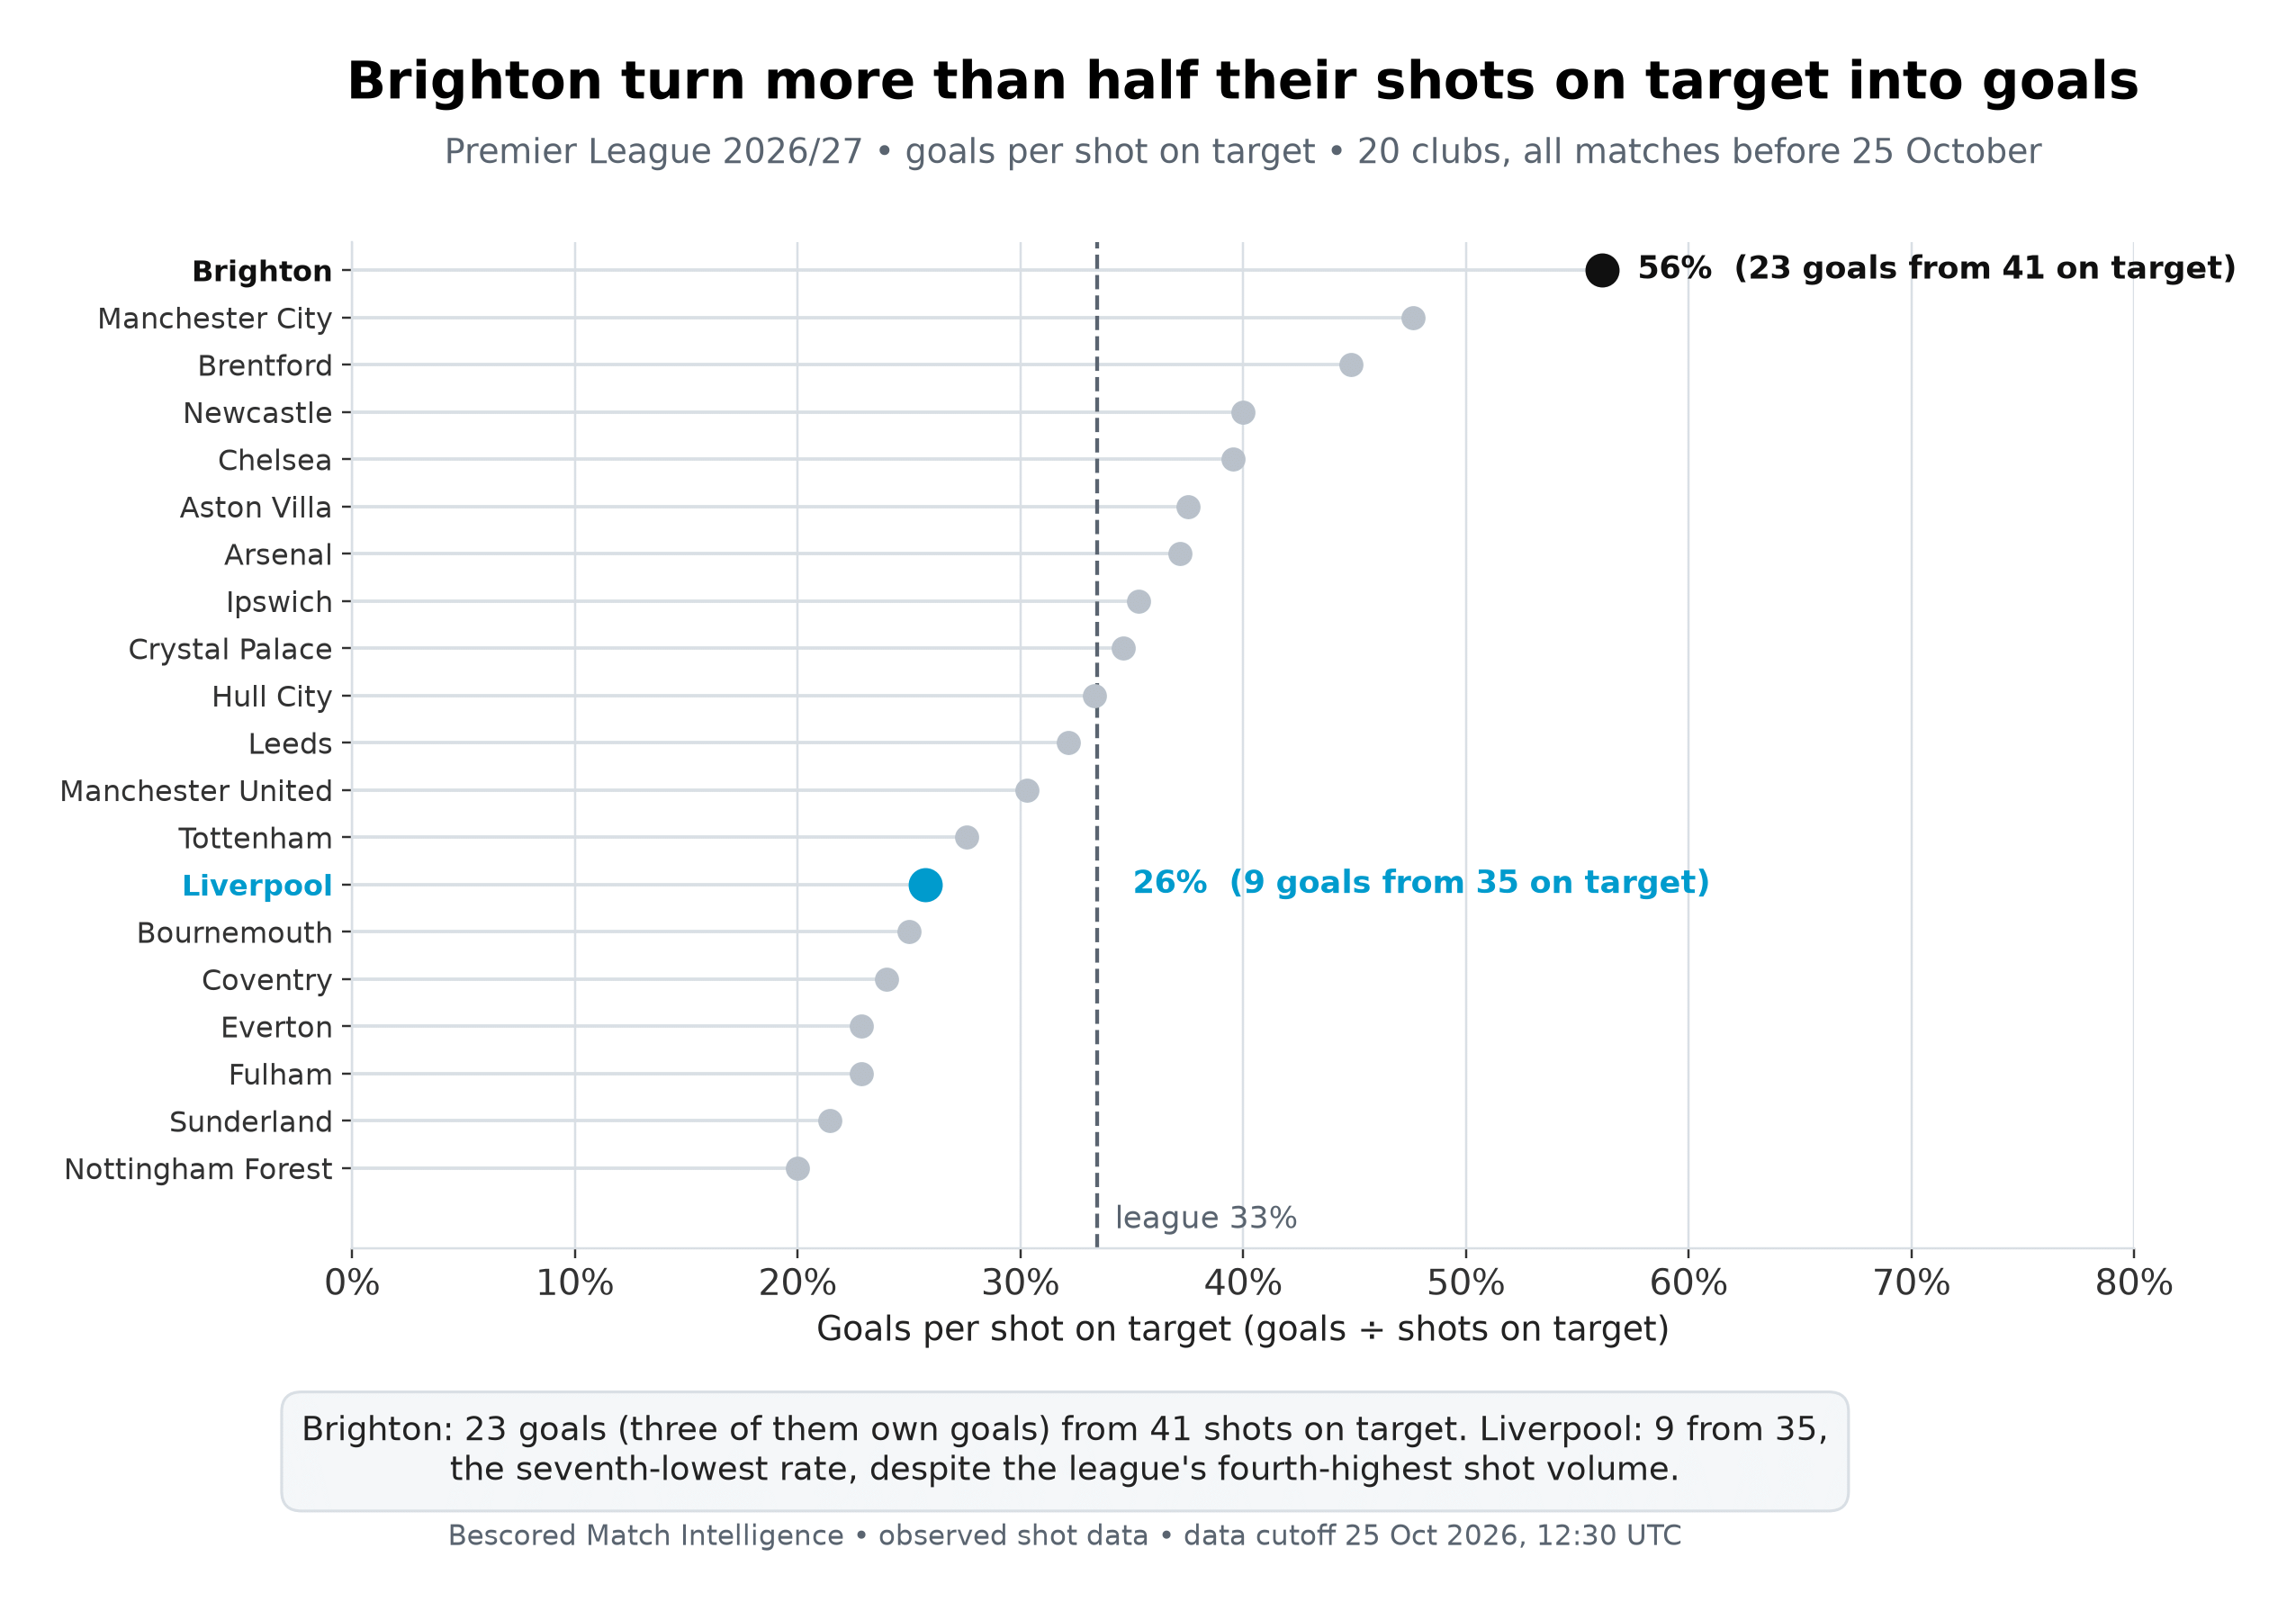
- Brighton score with 56% of their shots on target against a league rate of 33%; Liverpool convert 26%.
- Bescored's model estimates 44% Brighton, 26% draw, 30% Liverpool, while Elo ratings have the sides almost level.
Liverpool travel better than they host
On the road Liverpool have been hard to stop: 10 points from four league trips, 2.50 per match and no defeat. Anfield has told a different story. Two points from three matches. It was a 2–2 draw with Nottingham Forest, a 0–0 draw with Fulham, and a 0–3 loss to Manchester City. Only Forest take fewer points per home match this season.
The run reaches back into last spring. Liverpool’s last five league games at Anfield yielded no wins (0–4–1) and four points. The 8.4-point gap compared with Bescored’s pre-match model shows underperformance. The last home league win was 3–1 against Crystal Palace on 25 April 2026. Last season, Liverpool still averaged 1.89 points per home match.
Three home games show a small sample. City scored all three goals after Ryan Gravenberch’s red card on 62′. Liverpool have also won both cup ties at Anfield this autumn, 3 – 1 against Tottenham and 4 – 3 against Villarreal on Tuesday.
Brighton strike before the break, Liverpool after it
Brighton do their damage early. They have scored 11 first-half goals, two more than anyone else, found the net before the interval in 5 / 7 matches and led at half-time four times. They won all four. Across the league 40.8% of goals arrive before the break; for Brighton the share is 48%.
Liverpool run on a later clock. Seven of their nine goals came after half-time, and they have scored in the first half in only 1 / 7 matches, twice inside ten minutes at Ipswich. They have fallen behind first in 4 / 7 games and still taken five points from them, including the win at Brentford, where both goals came after the hosts went down to ten men.
That sets up the central contest. Brighton have conceded one goal after the break all season, the fewest in the league, and held that line while playing more than half an hour with ten men at Sunderland. Their first halves have been less watertight: four of the five goals they have conceded came before the interval, though none in their last four matches.
Brighton’s finishing is running far above the league
Brighton lead the league in shots (17.7 per match) and shots on target (5.9), and they have turned 56% of those on target into goals, against a league rate of 33%. Three of their 23 goals were own goals; without them the rate is 49%, still the best in the division. Eleven different players have scored, none more than three times.
That efficiency explains most of the 4.3-point cushion Brighton hold over the model’s expectation (16 points from 11.7 expected points), and rates that high rarely last a full season. The volume behind it is real, though: nobody puts more shots on target.
Liverpool take 15.7 shots per match, fourth most, but have scored with 26% of their shots on target, 14th in the league. Alexander Isak has five of their nine goals. Víctor Muñoz, with two, is listed as doubtful and Dominik Szoboszlai as missing. Their shooting meets a defence that allows 3.3 shots on target per match, third fewest in the league.
The model sides with Brighton, the history with Liverpool
Bescored’s pre-match model estimates a 44% chance of a Brighton win, 26% for a draw and 30% for Liverpool. Its goal-rate estimates, the model’s expected goals for each side rather than shot-based xG, are 1.67 for Brighton and 1.35 for Liverpool, with most of the gap after half-time (0.98 against 0.72). Bescored’s Elo ratings have the two clubs almost level, 1871.5 to 1864.5 in Liverpool’s favour.
Brighton played on Thursday, a 0 – 0 at Jablonec in the Conference League; Liverpool played on Tuesday. And Anfield has rarely been kind to Brighton: in nine Premier League visits since 2017/18 they have won once, 1 – 0 in February 2021, and Liverpool’s record is 6 – 2 – 1. Liverpool won both Anfield meetings last season, 2 – 0 in the league and 3 – 0 in the FA Cup.
Availability at the data cutoff: Liverpool are without Szoboszlai, Ekitike, Frimpong, Bradley, Leoni and Nallo, with Muñoz doubtful. Brighton are without Mitoma, Minteh, Ferguson, Wieffer, Tzimas, Azeez and Yohanna, with Struijk doubtful. None of Brighton’s league scorers this season is listed. Confirmed line-ups may differ.
The Bescored perspective
The two clubs’ seasons point at different halves. Brighton’s case rests on early goals and finishing well above the league norm; Liverpool’s rests on second halves, where seven of their nine goals have come and where Brighton have conceded once. If Brighton lead at the break, their season so far favours them: they won all four such matches. If it is level at half-time, Liverpool’s late scoring meets the league’s tightest second-half defence.
The model’s lean towards Brighton reflects that profile and Liverpool’s home form, but both rest on small samples. Liverpool’s record against Brighton at Anfield and Brighton’s Thursday trip are the main reasons not to treat the visitors’ edge as settled.
Source: Bescored Match Intelligence pre-match report. Data cutoff 25 October 2026, 12:30 UTC; Premier League 2026/27 matches before that date, seven per team, league baselines across all 20 clubs. Home and away splits cover three to five matches per venue. First-half goals include first-half stoppage time; own goals count for the team that benefits. Goals per shot on target = goals ÷ shots on target. Win/draw/loss probabilities and goal rates come from Bescored’s goal model (Poisson-based, generated 25 October 2026, 03:39 UTC), not shot-based xG; expected points = 3 × P(win) + P(draw). Availability reflects the pre-match injury feed at the cutoff.
Join the discussion
0 comments